 It's free, continue with Google
Landing page optimisation: the 2026 checklist for paid traffic
Landing page optimisation is making the page after the click keep the ad's promise, load fast on a phone, prove its claims and make the next step easy. Here is the checklist, with how to check each item.
 By
The short answer
Landing page optimisation means changing the page, not the campaign, so that a larger share of the people you already paid for take the next step. It matters more each year because the clicks cost more: the average Google Ads cost per click reached USD 5.42 in 2026 in WordStream's US benchmark, more than double the 2016 figure (WordStream by LocaliQ, Google Ads Benchmarks 2026). A page that wastes half its visitors wastes half that money.
What is landing page optimisation?
Landing page optimisation is the process of improving a page that receives campaign traffic so that more visitors complete its one intended action, such as an enquiry, a booking or a purchase. It covers what the page says, how fast it loads, how easy the form is, what proof it shows and whether it matches the ad that sent the visitor.
It is narrower than conversion rate optimisation across a whole site. A landing page has one audience, one promise and one action. That makes it the easiest page on your site to judge, because you know exactly why the visitor came.
The spelling split matters only for search. Australian and British marketers write "optimisation". US tools and most software documentation say "landing page optimization". They are the same discipline.
Why paid traffic makes it urgent
Every paid visit has a price tag attached before the visitor reads a word. Organic visits feel free, so a weak page hides. Paid visits do not hide: the cost per lead in your ads account is the landing page's report card.
The market is not getting cheaper. Alphabet reported Google cost per click up 7% in 2025, after 7% in 2024, on its own global measure (Alphabet Form 10-K for 2025). Australian search advertising reached AUD 8.6 billion in FY26, up 13.2%, which means more advertisers bidding for the same buyers (IAB Australia). The longer argument is in what to do when clicks cost more every year, and every guide in this cluster is collected under landing pages and paid traffic.
What does a high-converting landing page contain?
A high-converting landing page contains six parts in a predictable order: a headline that repeats the ad's promise, a subheading that says who it is for and what happens next, one primary call to action, proof beside the claim, a short form or booking step, and answers to the two or three objections that stop people. Everything else is optional.
The order matters because visitors decide in the first screen. If the first screen does not confirm they are in the right place, the rest of the page is never read.
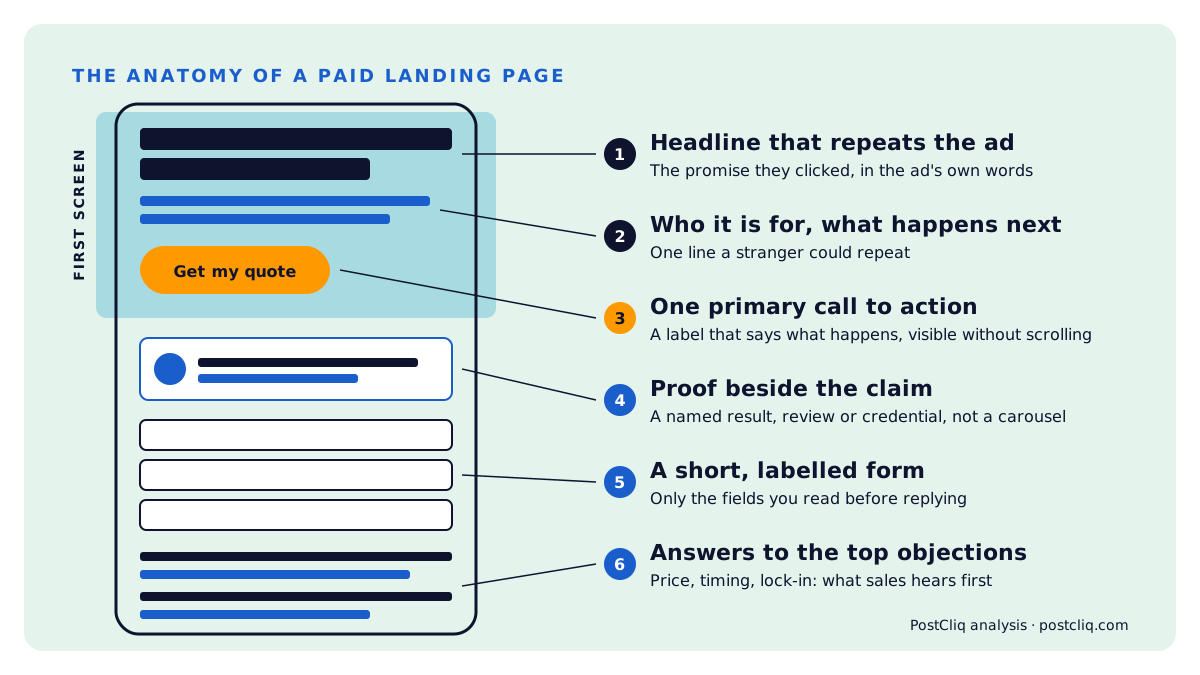
The first screen does most of the work
On a phone, the first screen is roughly the headline, one line of support, a button and perhaps a trust mark. That is the whole pitch for most visitors. Put the ad's promise in the headline, in the ad's words. Put the action in a button that says what happens ("Get my fixed quote", not "Submit").
Copy that a tired person can read
Unbounce found landing page copy written at a 5th to 7th grade reading level converted at 11.1%, 56% higher than copy at an 8th to 9th grade level (Unbounce Conversion Benchmark Report). That is a correlation across Unbounce pages, not proof that simpler words cause more enquiries. It is still the cheapest test you can run: shorter sentences, fewer abstractions, the buyer's own words.
The landing page optimisation checklist
This is the checklist. Each row says what good looks like and how to check it in minutes, without a testing tool. Work top to bottom, because the early rows are cheaper and more often broken.
| Element | What good looks like | How to check |
|---|---|---|
| Message match | The headline repeats the ad's main promise in the ad's words | Put the ad and the page headline side by side and read both aloud |
| Audience | The first screen names who the page is for | Ask: would the person you targeted recognise themselves in five seconds? |
| Offer and terms | Price, discount, timing or guarantee in the ad appears on the first screen | Search the page for every number the ad used |
| Primary action | One button, above the fold on a phone, with a label that says what happens | Load it on a phone and count the actions competing for attention |
| Mobile speed | Largest Contentful Paint 2.5 s or less, INP 200 ms or less, CLS 0.1 or less at the 75th percentile | PageSpeed Insights, field data first, lab data second |
| Form length | Only the fields you use to qualify or reply, usually three to five | Ask sales which fields they read before the first call |
| Form labels | Every field has a visible label, not just placeholder text | Tap each field on a phone and see if you still know what it asks |
| Proof | A specific result, logo, review or credential next to the claim it supports | Point at each claim and find the evidence within one scroll |
| Objections | The two or three reasons people hesitate are answered on the page | Read your last ten sales call notes for the questions asked first |
| Navigation | Few or no exits that do not serve the action | Count the links on the page that lead away from the goal |
| Tracking | The enquiry fires one conversion, once, in GA4 and in the ads account | Submit a test enquiry and watch both reports |
| Follow-up | The enquiry reaches a person who replies within a business day | Submit from a personal email address on a Friday afternoon |
Source: PostCliq analysis, with Core Web Vitals thresholds from web.dev
The last two rows are not about the page. They are on the list because a landing page that works while the form goes to an unmonitored inbox looks, in the ads account, exactly like a landing page that does not work.
Why is message match the first fix?
Message match is the first fix because it is the cheapest change with the most direct effect: a visitor who does not see the promise they clicked on assumes they are in the wrong place and leaves. Fixing it usually means rewriting a headline and a button label, not rebuilding a page, and it can be checked in two minutes.
Google's own advice to advertisers says the same thing in plain words. Its Quality Score guidance tells advertisers to "keep messaging consistent from ad to landing page" and to ensure the page "follows through on the ad's offer or call to action" (Google Ads Help).
The most common failure is not a lie. It is drift. The ad was rewritten for a promotion, and the page was not. Or five ad groups with five promises all point at one generic service page. The full explanation, with good and bad examples side by side, is in message match: what it is and how to check yours. If you want a structured way to do it, the message match worksheet takes ten minutes per campaign.
How fast does a landing page need to be?
A landing page should reach Largest Contentful Paint in 2.5 seconds or less, respond to taps within 200 milliseconds and keep layout shift at 0.1 or less, measured at the 75th percentile of real visits on mobile. Those are Google's Core Web Vitals thresholds, and only about half of websites meet them on mobile.
The HTTP Archive found 48% of websites pass all Core Web Vitals on mobile, against 56% on desktop, with Largest Contentful Paint the most common failure (HTTP Archive Web Almanac 2025). Paid traffic skews to mobile, so the weaker device carries the spend.
The evidence that speed moves conversion is older than most people quoting it admit, but it points the same way.
Source: Portent, Site Speed is (Still) Impacting Your Conversion Rate, 2022
Portent's analysis of 100 million page views found B2B sites loading in 1 second converted 3 times better than sites loading in 5 seconds (Portent). It covered only 20 websites. A Deloitte study commissioned by Google found a 0.1 second improvement in mobile site speed lifted retail conversions 8.4% across 37 brands (Deloitte, Milliseconds Make Millions, 2020). Treat both as direction, not a forecast for your page.
What usually slows a landing page down
The usual causes are mundane: a hero image several megabytes large, a video that autoplays above the fold, a page builder loading scripts for widgets the page does not use, and three or four tracking tags firing before the headline renders. None of these needs a rebuild. Most need an afternoon.
How short should the form be?
A landing page form should ask only for the information you need to reply to the enquiry and decide whether it is qualified, which for most B2B service businesses is three to five fields. Every field you add is a reason to stop, and forms already lose about a third of the people who start them.
Zuko's form analytics benchmark found 34% of people who start a form do not finish it (Zuko). That is a vendor benchmark with an undisclosed sample, so use it as a warning rather than a target.
Labels matter as much as length. The WebAIM Million found 51% of the top one million home pages had form inputs without proper labels (WebAIM Million 2026). A field that relies on placeholder text loses its question the moment someone starts typing, which is worst on a phone. The enquiry form review kit covers the full set of form checks.
Where should proof sit on the page?
Proof should sit directly beside the claim it supports, within the same scroll, not collected in a testimonial carousel at the bottom of the page. A visitor who reads "trusted by Australian councils" wants to see which councils now, not four screens later.
Good proof is specific: a named client with a result, a review count with the platform named, a credential with the issuing body. Weak proof is generic: "industry-leading", five unnamed stars, logos with no context. If you cannot name the proof, it is not proof yet. Find one real result and put it where the claim is.
Objections are proof in another form
The questions a buyer asks on a sales call are the objections your page failed to answer. Price, timeframe, lock-in and "do you work with businesses like mine" come up in almost every service category. Answer the two most common ones in plain sentences on the page, near the form.
Does the landing page change what you pay for the click?
Yes. Google lists landing page experience as one of the three components of Quality Score, and states that ad quality and landing page quality help decide Ad Rank, which sets where your ad shows. The page after the click therefore affects the position and the price of the click before it.
Google's documentation on the auction puts it directly: "even if your competition bids higher than you, you can still win a higher position, at a lower price, with high-quality ads and landing pages" (Google Ads Help, Ad Rank). Google publishes no weights, so nobody can tell you how much a better page saves. What it does tell you is where to look: the landing page experience status beside each keyword.
If that status says "below average", the diagnosis and the fixes are in how to fix a below average Google Ads landing page experience.
A worked example: what a better page is worth
Here is the arithmetic, with invented figures so you can replace them with your own. None of these numbers is a benchmark or a promise.
Say you spend AUD 5,000 a month on search at an average cost per click of AUD 4.00. That buys 1,250 clicks. At a 3% landing page conversion rate you get 37.5 enquiries, a cost per lead of about AUD 133.
| Conversion rate | Clicks | Enquiries | Cost per lead |
|---|---|---|---|
| 3.0% | 1,250 | 37.5 | AUD 133 |
| 4.0% | 1,250 | 50 | AUD 100 |
| 4.5% | 1,250 | 56 | AUD 89 |
Source: PostCliq analysis, illustrative inputs
Moving from 3% to 4.5% cuts the cost per lead by a third. To get the same cost per lead by buying cheaper clicks instead, the average click would have to fall from AUD 4.00 to about AUD 2.67. On Alphabet's figures, clicks have been going up, not down, by about 7% a year. The page is the lever you actually control.
The honest limit: a page already converting at 10% has less room than one at 2%, and a page cannot fix an offer nobody wants. If the arithmetic says a realistic improvement would add less than one qualified enquiry a month, your first problem is traffic.
What changes for seasonal and promotional campaigns?
Seasonal campaigns need the same checklist with two extra rows: the offer's dates and terms must be on the first screen, and the page must be ready and tested before the traffic arrives. Promotions fail at message match more often than evergreen campaigns because the ad changes weekly and the page does not.
In Australia that means EOFY in June and Click Frenzy and Black Friday in November. The Australian Retailers Association and Roy Morgan forecast Australians would spend AUD 6.8 billion over Black Friday to Cyber Monday 2025 (ARA and Roy Morgan), a pre-event survey forecast that includes in-store. The Black Friday landing page checklist has the retail version, with 30 checks to run before 27 November.
How PostCliq checks a landing page
PostCliq is a free website audit from WP Creative, an Australian website growth agency. It reads a site's public pages the way a careful visitor would, then produces a private report with evidence and three quick wins to make first.
For landing pages it checks speed and page experience using Lighthouse lab data and Chrome UX Report field data, the forms and calls to action, content clarity, trust signals and accessibility. It also checks whether the primary call to action is visible on the first screen of a phone, and whether the page lays out cleanly at that size.
What it does not do matters as much. It never submits your forms, logs in or changes your site. It can read Google Ads spend and clicks by landing page if you connect it, read-only, but not the ads themselves, so it cannot compare a specific ad with a page for you. For that, paste the ad into the message match checker prompt. The single-page version is the landing page audit.
When the page is fine and the campaign is not
Sometimes the landing page is not the problem. If the enquiry rate held for organic and direct visitors and fell only for paid, the likelier cause is who the campaign is now reaching, or what the ad now promises.
Split your enquiry rate by channel for two equal periods before you touch the page. The method is in how to tell a website problem from a campaign problem. It takes an afternoon and saves a quarter of rework in the wrong place.
What to do next
- Pick the landing page with the most paid spend behind it this month. Not the best one. The expensive one.
- Put its top ad beside the page on a phone and run the first three rows of the checklist: message match, audience, and offer and terms.
- Run PageSpeed Insights on the page and note the field data for Largest Contentful Paint, INP and CLS.
- Submit the form from a personal email address and time the reply.
- Check the landing page experience status for the campaign's top keywords in Google Ads.
- Fix the first failing row, then the next. Change one thing at a time so you can tell what worked.
- Run a free PostCliq audit to check the rest of the site the page links to, and re-run it weekly to confirm the fixes held.
Frequently asked questions
What is landing page optimisation in simple terms?
Landing page optimisation is improving the page people arrive on after clicking an ad or link, so more of them do what you want, such as enquire or buy. It covers the headline, the offer, speed, the form, the proof and the call to action. The goal is more results from the same traffic, not more traffic. It is sometimes written landing page optimization, which is the US spelling of the same thing.
What is a good landing page conversion rate?
Unbounce's benchmark puts the median landing page at 6.6%, with industries ranging from 3.8% to 12.3%. Those are Unbounce-built campaign pages with a single goal, so they run higher than whole-site rates. Compare your page with its own past performance and with pages sending similar traffic, rather than with a single industry average. A B2B page asking for a sales call will convert lower than one offering a free download.
How long does landing page optimisation take?
The first pass takes about an hour: compare the ad with the page, test the page on a phone, run a speed test and submit the form. Most fixes that come out of it, such as a new headline, a shorter form or a lighter hero image, take a day or two. Allow two to four weeks of traffic afterwards before judging the result, so a quiet week does not mislead you.
Do I need A/B testing to optimise a landing page?
No. A/B testing needs enough traffic to reach a reliable result, and Optimizely's analysis of 127,000 experiments found only about 12% produced a statistically significant win. Fix what is clearly broken first, such as a mismatched headline, a slow page or a form that fails on mobile. Test only when you have two reasonable options and enough conversions each month to tell them apart.
Does landing page quality affect Google Ads costs?
Google says it does. Landing page experience is one of the three Quality Score components, and Google states that high-quality ads and landing pages can win a higher position at a lower price even against higher bids. Google does not publish how much weight the page carries, so treat any precise saving you read about as a guess. Check the landing page experience status beside each keyword.
Should every ad group have its own landing page?
Not necessarily. Every distinct promise needs a page that keeps it, which is a different rule. If five ad groups make the same offer to the same audience, one page can serve them. If they promise different services, prices or audiences, they need different pages, or at least different headlines. Map ads to promises first, then count how many pages you actually need.
Turn more visits
into customers.
Test your key buying journey. See where customers and AI agents get stuck, and what to fix first.
Free. No credit card.