 It's free, continue with Google
Average ecommerce conversion rate in 2026, and how to raise yours
The average ecommerce conversion rate sits between about 1.4% and 2.7% of visits, depending on whose data you read. Here are the benchmarks by industry and device, what the mobile gap costs, and the fixes ranked by impact.
 By
The short answer
The average ecommerce conversion rate is about 1.4% for a typical Shopify store (Littledata, 2,800 Shopify stores, 2023 data) and 2.71% across Dynamic Yield's larger enterprise retailers (Dynamic Yield by Mastercard, rolling twelve months). If your store converts under 1%, you almost certainly have a fixable leak. If it converts over 3%, you are already in the top fifth of Shopify stores and the next gains are harder.
What is an ecommerce conversion rate?
An ecommerce conversion rate is the share of visits, or visitors, that end in a completed order. Divide orders by sessions for the period and multiply by 100. A store with 20,000 sessions and 300 orders in a month converts at 1.5%. Check which denominator your tool uses before you compare.
The denominator matters more than most teams realise. GA4 reports a session conversion rate and a user conversion rate, and on the same store in the same month they give different numbers, because a returning shopper can have several sessions. Shopify's own reports count sessions differently again. Pick one definition, write it down, and never compare a Shopify number with a GA4 number or with a benchmark that used the other one.
What is the average ecommerce conversion rate in 2026?
The honest answer is a range, not a number. The three credible benchmarks below put the average between 1.4% and 2.71%. They disagree because each measures a different population: small Shopify stores, large enterprise retailers, or lead-generation-heavy retail. None of them is Australian-specific, and none is wrong.
| Source | Average | Who is in the sample | Main limitation |
|---|---|---|---|
| Littledata | 1.4% | 2,800 Shopify stores | 2023 data, Shopify only |
| Dynamic Yield (Mastercard) | 2.71% | 400+ enterprise retailers, rolling 12 months | Large brands, vendor customer base |
| Ruler Analytics, retail and ecommerce | 2.4% | Ruler customers, 13 industries, 110M+ sessions | Counts leads and calls as well as sales |
| Littledata, top 20% of stores | 3.2% or more | As above | Threshold, not an average |
Source: Littledata ; Dynamic Yield benchmarks; Ruler Analytics, May 2026
Three things follow from the table.
- Store size moves the number. Enterprise retailers with known brands, loyal customers and big email lists convert higher. A small store living on paid social traffic will sit nearer 1%.
- The definition moves the number. Ruler's retail figure of 2.4% (Ruler Analytics, 26 May 2026) counts tracked leads and calls, not only checkouts.
- The date moves the number. Littledata's figures are from 2023. Conversion rates drift with traffic mix, so treat any single benchmark as a starting point for a question, not a target.
For the lead-generation side of the same question, with benchmarks by industry and channel, see what is a good conversion rate. For why a percentage alone can mislead, read what a conversion rate actually means.
How does ecommerce conversion rate vary by industry?
Industry changes the average more than any other factor. Dynamic Yield's data shows beauty and personal care converting at 5.39% while luxury and jewellery converts at 0.7%. The pattern is price and risk: cheap, repeat, low-risk purchases convert easily; expensive, considered ones do not.
Source: Dynamic Yield by Mastercard, ecommerce conversion rate benchmarks
Ruler Analytics puts the mechanism plainly.
Low-cost items tend to convert more easily because the risk to the buyer is low.
So compare yourself with stores that sell what you sell, at your price point. A furniture store converting at 1.5% is doing better than its category average. A skincare store at 1.5% is well below its category. Dynamic Yield also reports APAC averaging 1.47% against 2.86% in EMEA and 2.66% in the Americas, which is a reason for Australian stores not to panic when a US blog quotes 3%. It is not proof that Australian stores convert worse: the APAC sample includes many markets and Dynamic Yield does not break Australia out.
Why does mobile convert worse than desktop, and does it still?
On most stores, a phone visit is less likely to end in an order than a desktop visit, even though phones now bring most of the traffic. Littledata's Shopify data shows 1.2% on mobile against 1.9% on desktop. Dynamic Yield's enterprise data shows the reverse. Your own device report is the only one that counts.
The share of spending on phones keeps climbing. That is what makes the gap expensive.
The Adobe figures are US only (Adobe, 2025 holiday season, 7 January 2026). Salesforce's is global and drawn from its own commerce platform. Dynamic Yield's contrary result (2.88% mobile, 2.31% desktop) probably reflects large brands with strong mobile apps and saved payment details, where the phone is the easy device. For a typical mid-market store without those advantages, the Littledata pattern is the one to expect.
What the mobile gap is worth, worked through
Here is the arithmetic, with illustrative figures. Put your own in.
- A store gets 70% of sessions on mobile converting at 1.2%, and 30% on desktop converting at 1.9%.
- Blended conversion rate: (0.70 x 1.2%) + (0.30 x 1.9%) = 0.84% + 0.57% = 1.41%.
- Close half the mobile gap, so mobile converts at 1.55%: (0.70 x 1.55%) + 0.57% = 1.66%.
That is an 18% lift in orders without a single extra visitor, and it comes entirely from the device that already brings most of the traffic. The desktop experience did not change.
What is a good ecommerce conversion rate for your store?
A good ecommerce conversion rate is one that beats your own last year and your category's average. On Littledata's Shopify data, 3.2% puts a store in the top 20% and 4.7% in the top 10%. Below 1% usually means a technical or trust problem rather than a weak market.
Use the thresholds as a rough ladder, not a verdict.
| Your conversion rate | What it usually means | First place to look |
|---|---|---|
| Under 0.8% | Something is broken or the traffic is wrong | Tracking, mobile checkout, ad targeting |
| 0.8% to 1.4% | Below the Shopify average | Speed, delivery costs shown late, product page clarity |
| 1.4% to 3.2% | Around average to good | Mobile gap, returns policy, payment options |
| 3.2% to 4.7% | Top 20% | Average order value, repeat purchase |
| Above 4.7% | Top 10% | Traffic growth; conversion has less room |
Source: Thresholds from Littledata; diagnosis is PostCliq analysis
Two warnings. A very high rate can mean you are under-investing in new traffic and selling mostly to existing customers. And a rate that falls after a big campaign may simply mean the campaign brought colder visitors, which is not a site problem.
Where do online stores lose the most conversions?
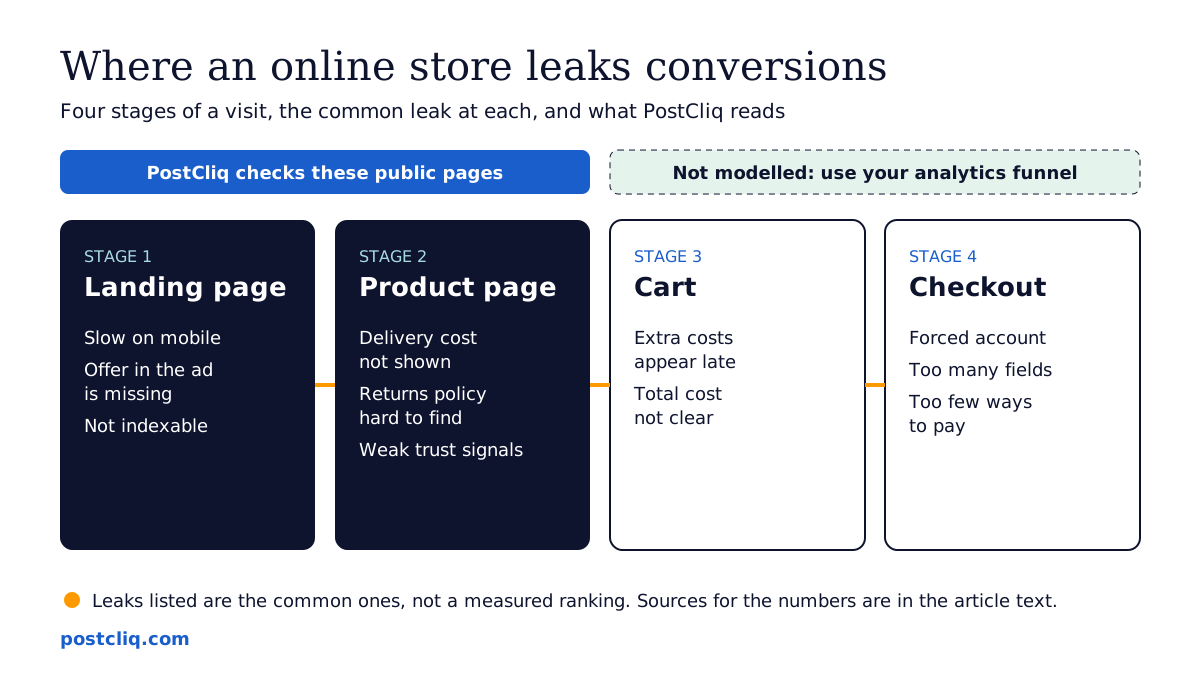
Most lost orders trace back to four things: surprise costs at checkout, slow pages, forced accounts and weak trust. Baymard's survey of US shoppers found 40% of those who abandoned checkout did so because extra costs were too high. Each of these is a post-click problem the store owns.
The evidence, in order of how often it shows up:
- Surprise costs. 40% of US shoppers who abandoned a checkout blamed extra costs such as shipping, tax and fees (Baymard Institute, updated 22 September 2025; excludes the "just browsing" group).
- Speed. A 0.1 second improvement in mobile site speed was associated with 8.4% more retail conversions in a Google-commissioned Deloitte study of 37 brands (Deloitte, Milliseconds Make Millions, 2020). It is old and correlational, and still the most cited speed study.
- Core Web Vitals. Only 48% of websites pass all Core Web Vitals on mobile, against 56% on desktop (HTTP Archive Web Almanac 2025). Most sites fail on the device that brings most of the shoppers.
- Forced accounts and long forms. 18% abandoned because the site required an account, and 17% because checkout was too long or complicated (Baymard Institute).
The full breakdown of checkout reasons, and the fixes that recover carts, is in why seven in ten carts are abandoned.
How do you raise your ecommerce conversion rate? Fixes ranked
Start with the fixes that are cheap, affect every visitor and have evidence behind them: show delivery costs early, speed up mobile, allow guest checkout. Leave redesigns and A/B testing programmes until those are done. The table ranks fixes by likely impact against effort.
| Rank | Fix | Why it works | Effort | Does PostCliq check it? |
|---|---|---|---|---|
| 1 | Show delivery costs and thresholds on product pages | Extra costs are the top avoidable reason (40%) | Low | ◐ reads what the page states |
| 2 | Offer guest checkout | 18% abandon over forced accounts | Low to medium | ✕ checkout not modelled |
| 3 | Fix mobile speed (LCP under 2.5 s) | Most shoppers are on phones; mobile fails vitals most | Medium | ✓ Lighthouse lab and CrUX field data |
| 4 | Match ad and email promises to the landing page | Visitors leave when the offer they clicked is missing | Low | ✕ compare the ad with the page yourself |
| 5 | Put returns policy and trust marks near the buy button | 13% abandon over returns policy, 19% over card trust | Low | ✓ trust signals |
| 6 | Add the payment methods your buyers use | 9% abandon over too few payment methods | Medium | ✕ checkout not modelled |
| 7 | Make product pages indexable and fast to crawl | Search and AI shopping traffic cannot convert if it never arrives | Low | ✓ robots, sitemap, indexing |
| 8 | Cut checkout fields toward 12 to 14 elements | Baymard's average US checkout has 23.48 | Medium to high | ✕ checkout not modelled |
Source: Abandonment reasons and field counts from Baymard Institute; ranking and effort are PostCliq analysis
For the full list of conversion fixes beyond ecommerce, see how to increase your website conversion rate. If you have a sale coming, the Black Friday landing page checklist turns the table above into dated tasks.
What is a small conversion lift worth?
On most stores, a small conversion lift is worth more than the same percentage increase in traffic, because it costs less and applies to every visit. Worked through on illustrative figures, a store moving from 1.4% to 1.7% adds about AUD 14,400 a month without buying one more click.
The arithmetic, with figures labelled as invented for the example:
- 40,000 sessions a month, converting at 1.4%, is 560 orders.
- At an average order value of AUD 120, that is AUD 67,200 a month.
- Lift the rate to 1.7% (a 0.3 point change) and orders rise to 680, or AUD 81,600.
- The difference is AUD 14,400 a month, a 21% increase.
To get the same result from traffic, you would need 8,600 more sessions a month at the old rate. With the average Google Ads click at USD 5.42 in WordStream's 2026 benchmark (WordStream by LocaliQ, US SMB campaigns), that traffic is not cheap, and ecommerce clicks in your category may cost more or less. The point is the shape: a conversion gain keeps paying every month, and a traffic gain stops the day the budget does.
This is a range for planning, not a promise. Your gain depends on where your leaks are, and PostCliq will not tell you that you are "losing" a dollar figure.
How PostCliq checks an online store
PostCliq reads up to 50 public pages of a store the way a careful shopper would. It recognises that the site is an ecommerce store and checks speed and page experience (Lighthouse lab data and Chrome UX Report field data), search access, trust signals, accessibility, content clarity and AI readiness.
It does not add products to a cart, log in or go through checkout, so it does not model cart or checkout behaviour. For those stages, use your analytics funnel and session recordings. The report gives three quick wins to make first, and a weekly re-audit shows whether the fixes held. You can see how PostCliq works or read the methodology behind the checks.
What to do next
- Pull your conversion rate for the last 12 months, split by device, from one source. Write down which denominator it uses.
- Compare it with your category, not with a headline average. Use the industry chart above.
- Work out your mobile gap and what closing half of it is worth, using the arithmetic in the mobile section.
- Fix rank 1 in the table this week: show delivery costs on product pages.
- Run a free PostCliq audit of your store to find speed, trust, search access and clarity problems on your public pages.
- If a sale is coming, work through the Black Friday landing page checklist before 27 November.
More in the ecommerce conversion hub.
Frequently asked questions
What is a good conversion rate for ecommerce?
A good ecommerce conversion rate is above your category average and above your own figure from last year. On Littledata's Shopify benchmark, 3.2% puts a store in the top 20% and 4.7% in the top 10%. Categories differ widely: beauty stores convert far higher than furniture or jewellery stores, so compare like with like before you judge a number.
Is a 2.5% conversion rate good for an online store?
For most stores, yes. A 2.5% conversion rate is well above Littledata's 1.4% Shopify average and close to Dynamic Yield's 2.71% average for enterprise retailers. Whether it is good for you depends on category and price. A 2.5% rate on furniture is strong; on beauty and personal care, where the enterprise average is 5.39%, it leaves room to grow.
How do you calculate ecommerce conversion rate?
Divide completed orders by sessions for the same period and multiply by 100. For example, 300 orders from 20,000 sessions is 1.5%. Some tools divide by users instead of sessions, which gives a higher figure. Pick one definition, keep it, and only compare with benchmarks that use the same one.
Why is my mobile conversion rate lower than desktop?
Usually because phones make checkout harder: small forms, slower pages on mobile networks, payment details not saved and costs revealed late. Littledata's Shopify data shows mobile at 1.2% against 1.9% on desktop. Check your mobile page speed, test the checkout on a real phone, and offer express wallets so buyers do not type card numbers.
What is ecommerce CRO?
Ecommerce CRO, or conversion rate optimisation, is the work of increasing the share of store visits that end in an order. It covers product pages, speed, trust, delivery and returns messaging, cart and checkout design, and testing. The best order is to fix known leaks first, such as hidden costs and slow mobile pages, and to test once those are done.
Does PostCliq audit my checkout?
No. PostCliq recognises ecommerce sites and checks public pages for speed, search access, trust signals, accessibility and content clarity. It never logs in, adds to cart or submits forms, so it does not model carts or checkout. Use your analytics funnel and session recordings for those steps, and PostCliq for the pages before them.
Turn more visits
into customers.
Test your key buying journey. See where customers and AI agents get stuck, and what to fix first.
Free. No credit card.